Comparing Nutrient Profiles of Common UK Snacks and Alternatives
An educational resource exploring the nutritional composition and energy density of everyday snack choices available in UK supermarkets and alternatives made from whole foods.
Educational Content Only
This resource presents factual, informational comparisons of food nutrient profiles. No promises of outcomes. Individual responses to foods vary widely.
Understanding Energy Density
Energy density refers to the amount of energy (calories) contained in a given weight of food, measured as kilocalories per gram (kcal/g). Different foods have different energy density values based on their water, fat, and fibre content. Understanding this concept helps contextualise how various snacks compare in their nutritional composition.
Foods with higher water and fibre content typically have lower energy density, whilst foods high in fat have higher energy density. This is purely informational and helps explain why different foods feel different in terms of portion size and composition.
Macronutrient Composition Basics
All foods are composed of macronutrients: carbohydrates, proteins, and fats. Additionally, fibre and water content influence both the nutritional profile and how foods are processed during digestion. Packaged snacks and whole foods differ significantly in their macronutrient distributions and processing levels.
- Fibre: Important for digestive health, present in whole grains, fruits, vegetables, and legumes. Most processed snacks contain minimal fibre.
- Protein: Essential for muscle and tissue maintenance. Found in nuts, seeds, yoghurt, and some whole grains.
- Added Sugars: Many packaged snacks contain added sugars, whilst whole fruits contain natural sugars alongside fibre and micronutrients.
- Fats: Present in both packaged snacks and whole foods; composition and type varies significantly.
- Water Content: Influences both energy density and satiety perception when consuming foods.
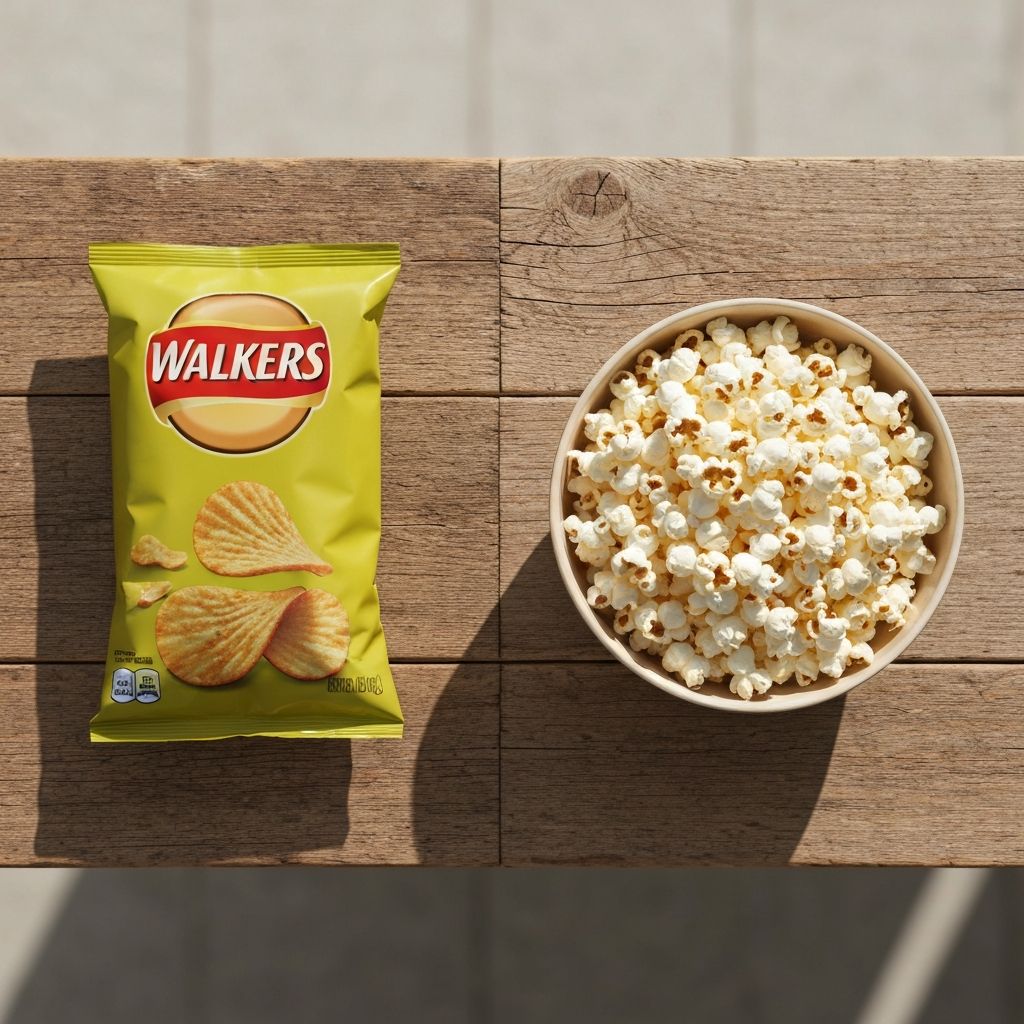
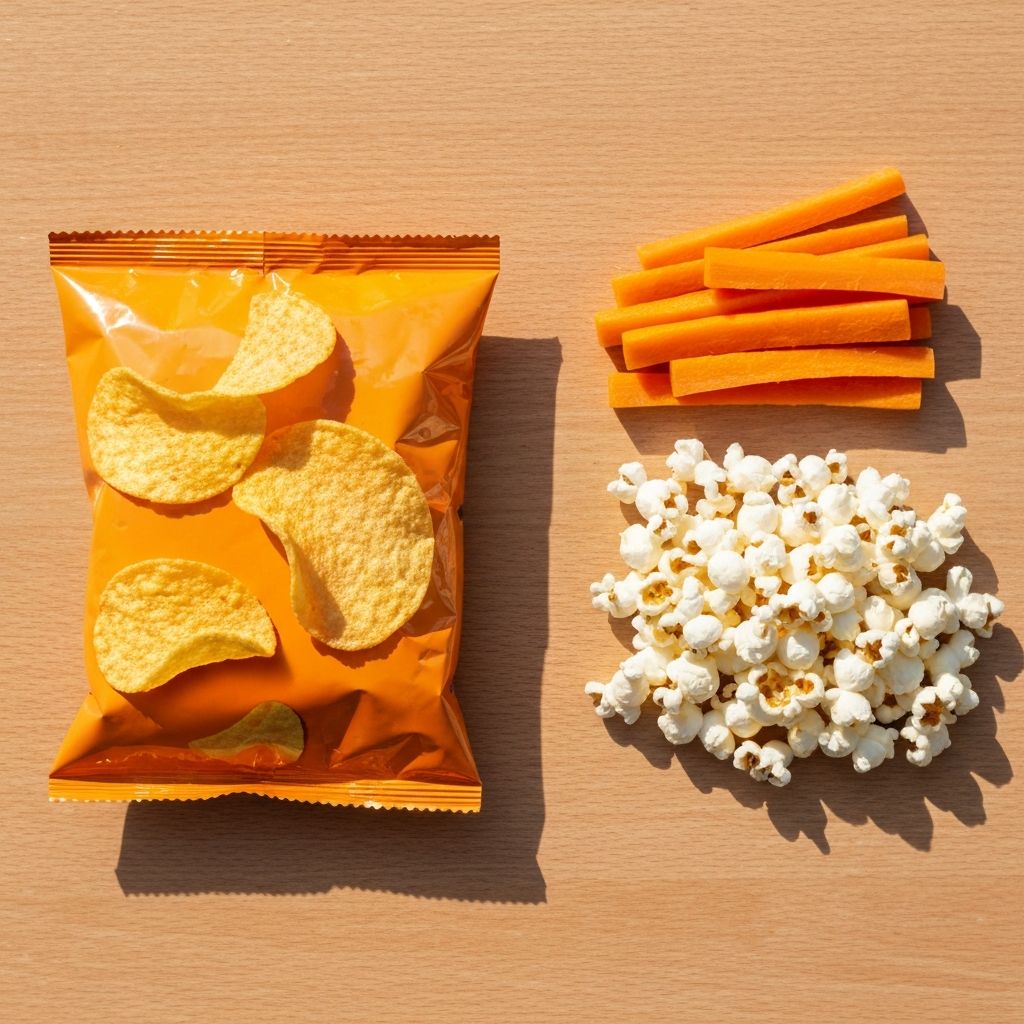
Popular Savoury Snacks Comparison
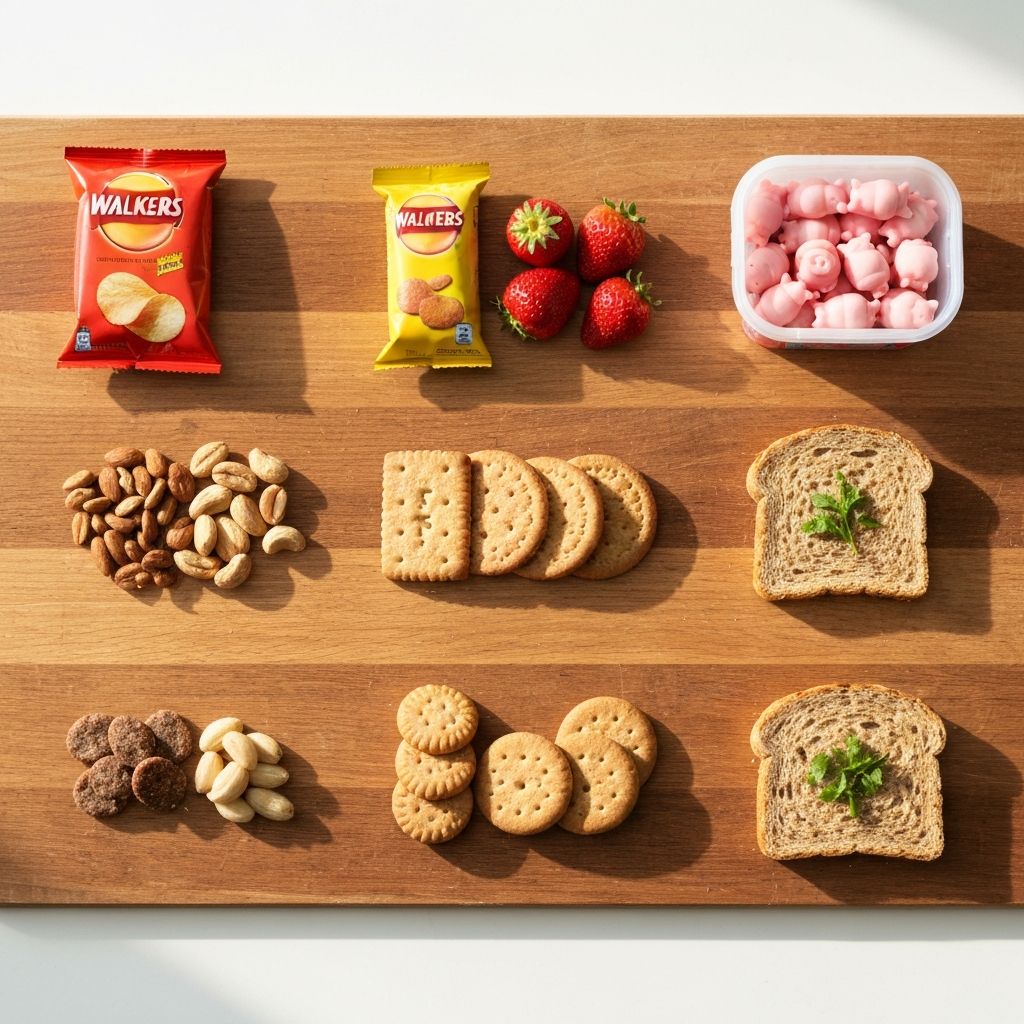
Savoury packaged snacks are among the most commonly consumed in UK households. Below is an informational comparison of their nutrient profiles alongside whole-food alternatives.
| Snack | Energy (kcal per 100g) | Fat (g per 100g) | Sugars (g per 100g) | Fibre (g per 100g) | Protein (g per 100g) |
|---|---|---|---|---|---|
| Walkers Crisps (typical) | 530 | 35 | 2 | 2 | 5 |
| Plain Popcorn (air-popped) | 387 | 4 | 0 | 9 | 12 |
| Carrot Sticks (raw) | 41 | 0.2 | 5 | 2.8 | 0.9 |
Chocolate and Confectionery Pairs
Chocolate bars and confectionery products are popular packaged snacks. The following table presents their nutrient profiles alongside whole-food alternatives.

| Snack | Energy (kcal per 100g) | Fat (g per 100g) | Sugars (g per 100g) | Fibre (g per 100g) | Protein (g per 100g) |
|---|---|---|---|---|---|
| Cadbury Dairy Milk (typical) | 535 | 30 | 56 | 0 | 7.7 |
| Fresh Raspberries | 52 | 0.7 | 5.4 | 6.5 | 1.2 |
| Plain Almonds (unsalted) | 579 | 50 | 4.4 | 12.5 | 21 |
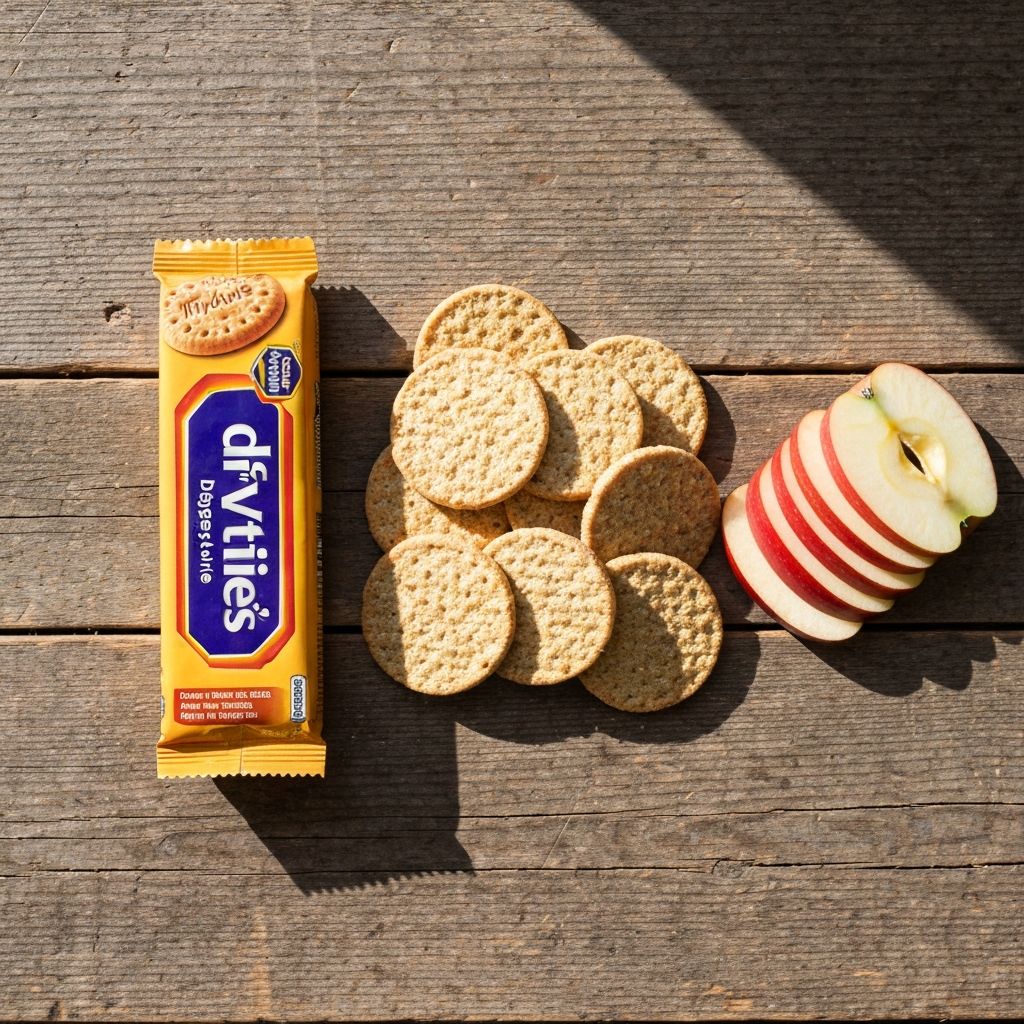
Biscuits and Sweet Baked Goods
Biscuits are commonly consumed in UK households. This section presents informational comparisons of nutrient profiles.
| Snack | Energy (kcal per 100g) | Fat (g per 100g) | Sugars (g per 100g) | Fibre (g per 100g) | Protein (g per 100g) |
|---|---|---|---|---|---|
| McVitie's Digestive (typical) | 471 | 21 | 21 | 3.2 | 6.8 |
| Oatcakes (plain) | 440 | 20 | 0.5 | 6 | 11 |
| Apple Slices (fresh) | 52 | 0.2 | 10 | 2.4 | 0.3 |
Sweet Snack Alternatives
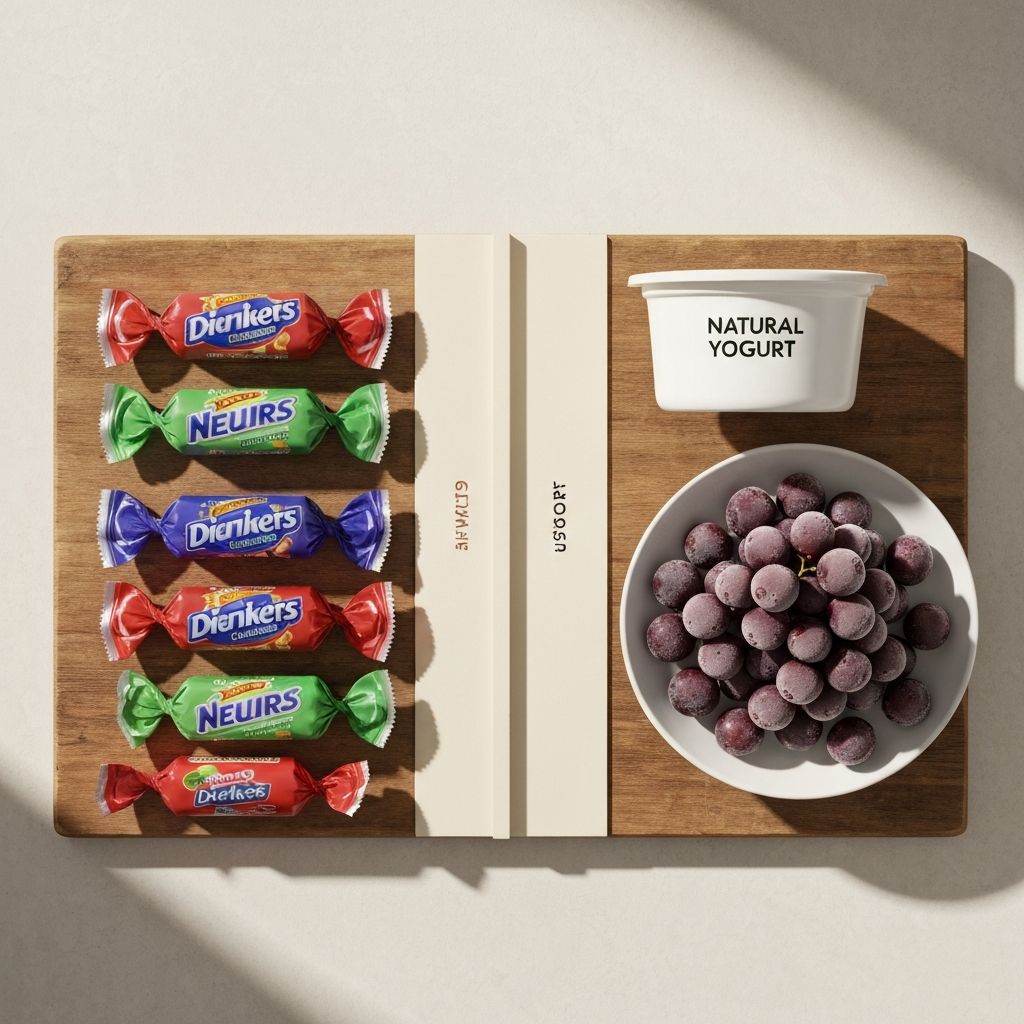
Sweets and confectionery represent a significant category of packaged snacks. Below is an informational comparison with alternative options.
| Snack | Energy (kcal per 100g) | Fat (g per 100g) | Sugars (g per 100g) | Fibre (g per 100g) | Protein (g per 100g) |
|---|---|---|---|---|---|
| Wrapped Hard Sweets (typical) | 327 | 0 | 82 | 0 | 0 |
| Greek-Style Yoghurt (plain) | 59 | 0.4 | 3.2 | 0 | 10 |
| Frozen Grapes | 67 | 0.4 | 17 | 0.9 | 0.7 |
Portion Size Context in UK Market
UK packaged snacks often come in pre-determined portion sizes that differ from how individuals might serve themselves at home. Understanding typical market pack sizes provides context for comparing nutrient intake across different snacking occasions.
- Single-serve crisp packets: typically 25–35g
- Standard chocolate bars: typically 30–50g
- Biscuit packs: typically 150–250g (multiple biscuits)
- Sweet packets: typically 100–200g
- Household servings of whole foods vary considerably based on individual preference and hunger
Processing Level Influence
The degree of processing in foods influences several factors that affect how foods are consumed and the eating experience:
- Eating Rate: Highly processed snacks are often consumed more quickly than whole foods requiring chewing, such as fresh fruit and vegetables.
- Satiety Perception: The texture, fibre content, and water content of foods influence how long satisfaction lasts after consumption.
- Energy Intake Context: Whole foods typically require more time and effort to consume, which can affect overall intake patterns in real-world settings.
- Taste and Flavour Intensity: Packaged snacks are often engineered for strong flavour profiles, whilst whole foods have naturally varying flavours and textures.
Links to Detailed Snack Comparisons
Explore detailed, in-depth comparisons of specific snack categories and their nutrient profiles:
Crisps vs Plain Popcorn and Vegetable Sticks
Nutrient breakdown and informational comparison of savoury packaged snacks and whole-food alternatives.
Read detailed comparison →Chocolate Bars Compared to Fresh Fruit and Plain Nuts
Factual comparison of chocolate confectionery and whole-food snack options in UK households.
Read detailed comparison →Digestive Biscuits vs Oatcakes and Apple Slices
Educational overview of biscuit category nutrient profiles and whole-food alternatives.
Read detailed comparison →Sweets and Confectionery vs Natural Yoghurt and Frozen Berries
Informational comparison of sweet packaged snacks and natural whole-food alternatives.
Read detailed comparison →Energy Density Across Popular UK Snack Categories
Comprehensive overview explaining energy density concepts across different snack types.
Read detailed comparison →Influence of Processing on Snack Eating Patterns
Educational explanation of how processing levels affect consumption patterns and satiety.
Read detailed comparison →Frequently Asked Questions
What is energy density?
Energy density is the amount of energy (kilocalories) present in a given weight of food, expressed as kcal per gram. Foods with lower energy density contain fewer calories per unit of weight, whilst foods high in fat (which contains 9 kcal per gram) have higher energy density.
How does fibre affect nutrient profiles?
Fibre is a carbohydrate that the body cannot fully digest. It is important for digestive health and is found primarily in whole grains, fruits, vegetables, and legumes. Most processed snacks contain minimal fibre, whilst whole foods are naturally higher in fibre content.
Why do packaged snacks have longer shelf life?
Packaged snacks are processed to remove water and moisture, which extends shelf life by preventing microbial growth. They also contain added preservatives, salt, and other additives. Whole foods like fresh fruit contain natural water and spoil more quickly.
What are macronutrients?
Macronutrients are the three main categories of nutrients that provide energy: carbohydrates (4 kcal per gram), proteins (4 kcal per gram), and fats (9 kcal per gram). All foods are composed of varying proportions of these macronutrients.
Do all individuals respond the same way to different snack options?
No. Individual responses to foods vary widely based on factors including personal taste preferences, cultural background, individual digestive responses, texture preferences, flavour sensitivities, and many other variables. This resource presents general nutritional information only.
How is satiety defined?
Satiety refers to the feeling of fullness and satisfaction after eating. It is influenced by food texture, fibre content, water content, protein content, eating rate, and portion size. Satiety perception is subjective and varies between individuals.
What is the satiety index?
The satiety index is a measure of how filling different foods are relative to their energy content. Foods high in protein, fibre, and water typically score higher on satiety indices. This is informational and individual responses vary.
Are packaged snacks always high in added sugars?
Not all packaged snacks contain high levels of added sugars. Some savoury snacks like crisps contain minimal sugars, whilst confectionery and sweet biscuits contain significantly higher levels. Checking individual product labels provides specific information.
How do portion sizes affect nutrient comparison?
Portion size directly affects total nutrient intake. Pre-packaged snacks come in fixed portions, whilst whole foods allow individual portioning. Comparing per-100-gram values provides a standardised way to understand nutrient density independent of portion size.
Is this resource a substitute for professional dietary advice?
No. This resource is educational only and presents factual nutritional information. It does not provide personalised dietary advice, medical recommendations, or health guidance. For individual dietary needs, consult with qualified healthcare or nutrition professionals.